Soumen Basak and I have run an set of 'Internal Linear Combinations', using the decomposition of 'observed' maps on needlet frames, to separate the CMB from contaminants in the set of simulations described here. The results posted use an old version of the perfomances of the instrument, as described in the following table (this will be fixed ASAP).
| nu (GHz) | 45 | 75 | 105 | 135 | 165 | 195 | 225 | 255 | 285 | 315 | 375 | 435 | 555 | 675 | 795 |
| delta-nu (GHz) | 15 | 15 | 15 | 15 | 15 | 15 | 15 | 15 | 15 | 15 | 15 | 15 | 15 | 15 | 15 |
| number of detectors | 64 | 150 | 200 | 275 | 375 | 575 | 900 | 575 | 375 | 100 | 64 | 64 | 64 | 64 | 64 |
| FWHM (arcmin) | 23.3 | 14.0 | 10.0 | 7.8 | 6.4 | 5.4 | 4.7 | 4.1 | 3.7 | 3.3 | 2.8 | 2.4 | 1.9 | 1.6 | 1.3 |
| I sensitivity (uK in a 1 arcmin2 pixel) | 5.20 | 3.82 | 3.75 | 3.69 | 3.74 | 3.68 | 3.70 | 6.01 | 9.98 | 26.64 | 67.79 | 147.6 | 787.3 | 4574 | 27923 |
| Q and U sensitivity (uK in a 1 arcmin2 pixel) | 8.99 | 6.61 | 6.48 | 6.37 | 6.46 | 6.36 | 6.40 | 10.39 | 17.25 | 46.03 | 117.15 | 255.1 | 1360.5 | 7904 | 48257 |
We ignore strong point sources (flux more than 100 mJy at 20 GHz for radio sources, and more than 500 mJy at 300 microns for IR sources), as we assume these will be known and subtracted from the data. We cut the COrE data into two independent subsets, each with sqrt(2) times the noise.
We compute, for the observed B modes, a set of ILC weights in needlet space, and apply them independently to the two data subsets, to produce two independent CMB maps with reduced foreground contamination. We then compute the cross spectrum of the two maps.
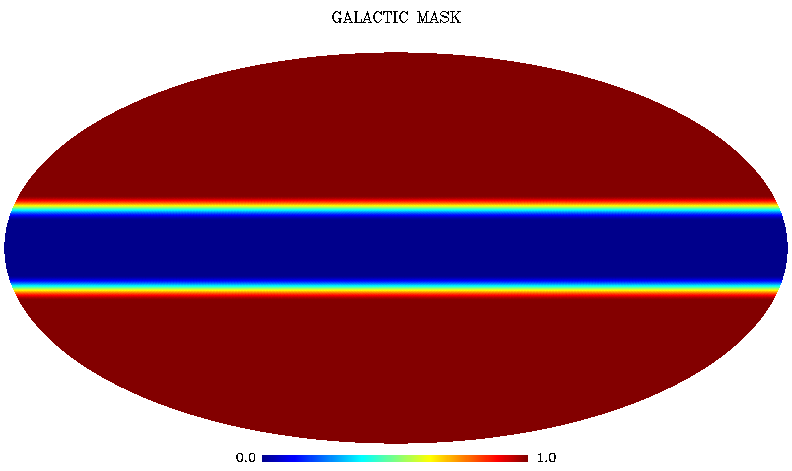
Here is the mask which has been used for the analysis of the simulations. The mask cuts completely the part of the sky at galactic latitudes lower than 10 degrees, and makes a smooth transition from 0 to 1 between galactic latitudes of 10 and 20. This mask, obviously, has not been optimised, but seems to do most of the job!

| Download | Description | Size | Format |
| mask_COrE.fits.gz | Mask for component separation | 37 kB | gzipped HEALPix fits map |
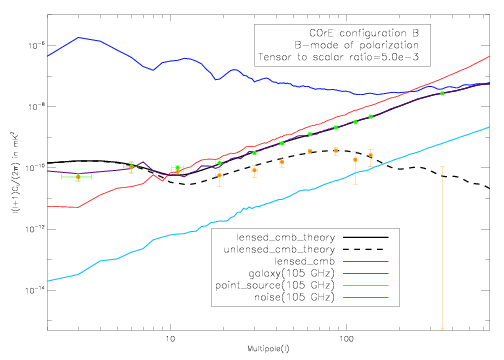
Here are the preliminary results of component separation. Green datapoints are the estimate of the band-averaged lensed BB spectrum. Yellow points are obtained from the green ones by subtracting the model lensing BB-spectrum (assumed to be known) for de-biasing.

Results can be downloaded below. The first file is the cross power spectrum from the two independent foreground-reduced data sets. The second is the binned (lensed) power spectrum (green data points). The third is the B-mode power spectrum after correction for lensing (yellow points). The last file gives the auto and cross power spectra of the errors on the reconstructed maps. As can be seen, the two error maps are correlated at low l, which indicates residual foreground emission and/or correlated biases. This may explain the point off (third bin), and requires further investigation. We may have to try less agressive masking. This correlation, however, decreases as l increases.
| Download | Description | Size | Format |
| cross_year_lensed_cl.txt | CMB power spectrum (from cross spectrum) | 48 kB | text file |
| cross_year_lensed_bin_cl.txt | CMB binned power spectrum | 4 kB | text file |
| cross_year_unlensed_bin_cl.txt | CMB binned power spectrum (debiased from lensing) | 4 kB | text file |
| cross_year_error_lensed_cl.txt | Auto and cross power spectra of errors between the two data subsets | 60 kB | text file |